Mixture model prediction and annotations
Source:R/stat-distrmix-eq.R, R/stat-distrmix-line.R
stat_distrmix_eq.RdStatistics stat_distrmix_line() and stat_distrmix_eq() fit a
Normal mixture model. While stat_distrmix_line() adds prediction
lines, stat_distrmix_eq() adds textual labels to a plot.
Usage
stat_distrmix_eq(
  mapping = NULL,
  data = NULL,
  geom = "text_npc",
  position = "identity",
  ...,
  orientation = NA,
  method = "normalmixEM",
  method.args = list(),
  n.min = 10L * k,
  level = 0.95,
  k = 2,
  free.mean = TRUE,
  free.sd = TRUE,
  se = FALSE,
  fit.seed = NA,
  fm.values = TRUE,
  components = NULL,
  eq.with.lhs = TRUE,
  eq.digits = 2,
  label.x = "left",
  label.y = "top",
  hstep = 0,
  vstep = NULL,
  output.type = NULL,
  na.rm = FALSE,
  parse = NULL,
  show.legend = NA,
  inherit.aes = TRUE
)

stat_distrmix_line(
  mapping = NULL,
  data = NULL,
  geom = "line",
  position = "identity",
  ...,
  orientation = NA,
  method = "normalmixEM",
  se = NULL,
  fit.seed = NA,
  fm.values = FALSE,
  n = min(100 + 50 * k, 300),
  fullrange = TRUE,
  level = 0.95,
  method.args = list(),
  k = 2,
  free.mean = TRUE,
  free.sd = TRUE,
  components = "all",
  n.min = 10L * k,
  na.rm = FALSE,
  show.legend = NA,
  inherit.aes = TRUE
)
Arguments
- mapping
The aesthetic mapping, usually constructed with
aes(). Only needs to be set at the layer level if you are overriding the plot defaults.- data
A layer specific dataset, only needed if you want to override the plot defaults.
- geom
The geometric object to use display the data
- position
The position adjustment to use for overlapping points on this layer.
- ...
other arguments passed on to
layer. This can include aesthetics whose values you want to set, not map. Seelayerfor more details.- orientation
character Either "x" or "y" controlling the aesthetic to which the density model is fit. With the default
orientation = NAthe orientation used is based on the mapping and nearly always correct.- method
function or character If character,
"normalmixEM"or the name of a model fit function are accepted, possibly followed by the fit function's method argument separated by a colon. The function must return a model fit object of class"mixEM".- method.args
named list with additional arguments. Not
dataorweightswhich are always passed through aesthetic mappings.- n.min
integer Minimum number of distinct values in the variable for fitting to the attempted. The default depends on
k.- level
Level of confidence interval to use (0.95 by default).
- k
integer Number of mixture components to fit.
- free.mean, free.sd
logical If TRUE, allow the fitted
meanand/or fittedsdto vary among the component Normal distributions.- se
logical If
TRUEstandard errors for the parameter estimates are returned in addition to the parameter estimates.- fit.seed
RNG seed argument passed to
set.seed(). Defaults toNA, indicating thatset.seed()should not be called.- fm.values
logical Add parameter estimates and their standard errors to the returned values (`FALSE` by default.)
- components
character One of
"all","sum", or"members"select which densities are returned.- eq.with.lhs
If
characterthe string is pasted to the front of the equation label before parsing or alogical(see note).- eq.digits
integer Number of digits after the decimal point to use for parameters in labels. If
Inf, use exponential notation with three decimal places.- label.x, label.y
numericwith range 0..1 "normalized parent coordinates" (npc units) or character if usinggeom_text_npc()orgeom_label_npc(). If usinggeom_text()orgeom_label()numeric in native data units. If too short they will be recycled.- hstep, vstep
numeric in npc units, the horizontal and vertical step used between labels for different groups.
- output.type
character One of "expression", "text", "markdown", "marquee", "latex", "latex.eqn", "latex.deqn" or "numeric".
- na.rm
a logical indicating whether NA values should be stripped before the computation proceeds.
- parse
logical Passed to the geom. If
TRUE, the labels will be parsed into expressions and displayed as described inplotmath. Default isTRUEifoutput.type = "expression"andFALSEotherwise.- show.legend
logical. Should this layer be included in the legends?
NA, the default, includes if any aesthetics are mapped.FALSEnever includes, andTRUEalways includes.- inherit.aes
If
FALSE, overrides the default aesthetics, rather than combining with them. This is most useful for helper functions that define both data and aesthetics and shouldn't inherit behaviour from the default plot specification, e.g.borders.- n
Number of points at which to predict with the fitted model.
- fullrange
logical Should the fit prediction span the full range of the plot, or just the range of the explanatory variable?
Value
The value returned by the statistic is a data frame, with n
rows of predicted density for each component of the mixture plus their
sum and the corresponding vector of x values. Optionally it will
also include additional values related to the model fit.
The value returned by stat_distrmix_line() is a data frame, with n
rows of predicted density for each component of the mixture plus their
sum and the corresponding vector of x values.
The value returned by stat_distrmix_eq() is a data frame, with one
row of estimates for each group of data in the plot.
Both statistics optionally also return additional values related to the model fit.
Details
stat_distrmix_line() is similar to
stat_density but in addition to fitting a single
distribution it can fit a mixture of two or more Normal distributions,
using an approach related to clustering. Defaults are consistent between
stat_distrmix_line() and stat_distrmix_eq().
stat_distrmix_eq() can be used to add matched textual annotations.
If k >= 2 a mixture of Normals model is fitted with
normalmixEM(), while if k == 1 a single
Normal distribution is fitted with function fitdistr().
Only for k == 1 the SE values are exact estimates.
Parameter fit.seed if not NA is used in a call to
set.seed() immediately before calling the model fit function. As the
fitting procedure makes use of the (pseudo-)random number generator (RNG),
convergence can depend on it, and in such cases setting fit.seed to
the same value in stat_distrmix_line() and in
stat_distrmix_eq() can ensure consistency, and more generally,
reproducibility.
The minimum number of observations with distinct values in the explanatory
variable can be set through parameter n.min. The default depends on
k, the number of components in the mix. Model fits with too few
observations are unreliable, thus, using larger values of n.min than
the default is wise.
Variables computed by stat_distrmix_line()
Some of the returned variables depend on the orientation.
- x
the
nvalues for the quantiles- component
A factor indexing the components and/or their sum
If fm.values = TRUE is passed then columns with diagnosis and
parameters estimates are added, with the same value in each row within a
group:
- n
numericthe number ofxvalues- .size
numericthe number ofdensityvalues- fm.class
characterthe most derived class of the fitted model object- fm.method
characterthe method, as given by theftfield of the fitted model objects
This provides a simple and robust approach to achieve effects like colouring or hiding annotations by group depending on the outcome of model fitting.
Variables computed by stat_distrmix_eq()
Some of the variables depend on the orientation:
- y
the location of text labels
- eq.label
characterstring for equations- n.label
characterstring for number of observations- method.label
characterstring for model fit method- lambda
numericthe estimate of the contribution of the component of the mixture towards the joint density- mu
numericthe estimate of the mean- sigma
numericthe estimate of the standard deviation- component
A factor indexing the components of the mixture and/or their sum
If SE = TRUE is passed then columns with standard errors for the
parameter estimates:
- mu.se
numericthe estimate of the mean- sigma.se
numericthe estimate of the standard deviation
If fm.values = TRUE the same additional columns are returned as by
stat_distrmix_eq(). This is wasteful of storage space as values are
stored in multiple copies and, thus, disabled by default. However, it
provides a simple and robust approach to achieve effects like colouring or
hiding of the model fit line by group depending on the outcome of model
fitting.
Output types
The formatting of character strings to be displayed in plots are marked as mathematical equations. Depending on the geom used, the mark-up needs to be encoded differently, or in some cases mark-up not applied.
"expression"The labels are encoded as character strings to be parsed into R's plotmath expressions.
"LaTeX", "TeX", "tikz", "latex"The labels are encoded as 'LaTeX' maths equations, without the "fences" for switching in math mode.
"latex.eqn"Same as
"latex"but enclosed in single$, i.e., as in-line maths."latex.deqn"Same as
"latex"but enclosed in double$$, i.e., as display maths."markdown"The labels are encoded as character strings using markdown syntax, with some embedded HTML.
"marquee"The labels are encoded as character strings using markdown syntax, with 'marquee' supported spans.
"text"The labels are plain ASCII character strings.
"numeric"No labels are generated. This value is accepted by the statistics, but not by the label formatting functions.
NULLThe value used depends on the argument passed to
geom.
If geom = "latex" (package 'xdvir') the output type used is
"latex.eqn". If geom = "richtext" (package 'ggtext') or
geom = "textbox" (package 'ggtext') the output type used is
"markdown". If geom = "marquee" (package 'marquee') the output
type used is "marquee". For all other values of geom the default
is "expression". Invalid values as argument trigger an error.
Position of labels
When data are grouped by mapping a factor to an aesthetic, e.g.,
colour, shape and/or linetype the model is fitted
separately to each group, and for each group a whole set of labels is
generated. If the argument passed to label.y is a vector of length
1, this value determines the position of the equation and/or other labels
for the first group, and the positions of the labels for the remaining
groups are generated by adding vspace based on the group number.
If the argument passed to label.y is a vector of length > 1, it is
used unchanged, possibly extended by recycling, ignoring vstep.
If the labels are rotated by 90 degrees then the automatic stepping is
best based on hstep with vstep = 0. Similarly as described
above, if label.x is a vector of length > 1, it is
used unchanged, possibly extended by recycling, ignoring hstep.
When using facets and with a grouping that does not repeat in each panel,
the automatic positioning in most cases will not be the desired one. Manual
positioning using a vector of length > 1 for label.x and/or
label.y is the currently available workaround.
See also
Other 'ggpmisc' statistics for model fits:
stat_fit_deviations(),
stat_fit_glance(),
stat_fit_tb(),
stat_fit_tidy(),
stat_ma_eq(),
stat_poly_eq(),
stat_quant_band()
Aesthetics
stat_distrmix_eq() understands the following aesthetics. Required aesthetics are displayed in bold and defaults are displayed for optional aesthetics:
| • | x or y | |
| • | group | → after_stat(component) |
| • | hjust | → "inward" |
| • | label | → after_stat(eq.label) |
| • | npcx | → after_stat(npcx) |
| • | npcy | → after_stat(npcy) |
| • | vjust | → "inward" |
stat_distrmix_line() understands the following aesthetics. Required aesthetics are displayed in bold and defaults are displayed for optional aesthetics:
| • | x or y | |
| • | group | → after_stat(component) |
| • | weight | → NULL |
Learn more about setting these aesthetics in vignette("ggplot2-specs").
Examples
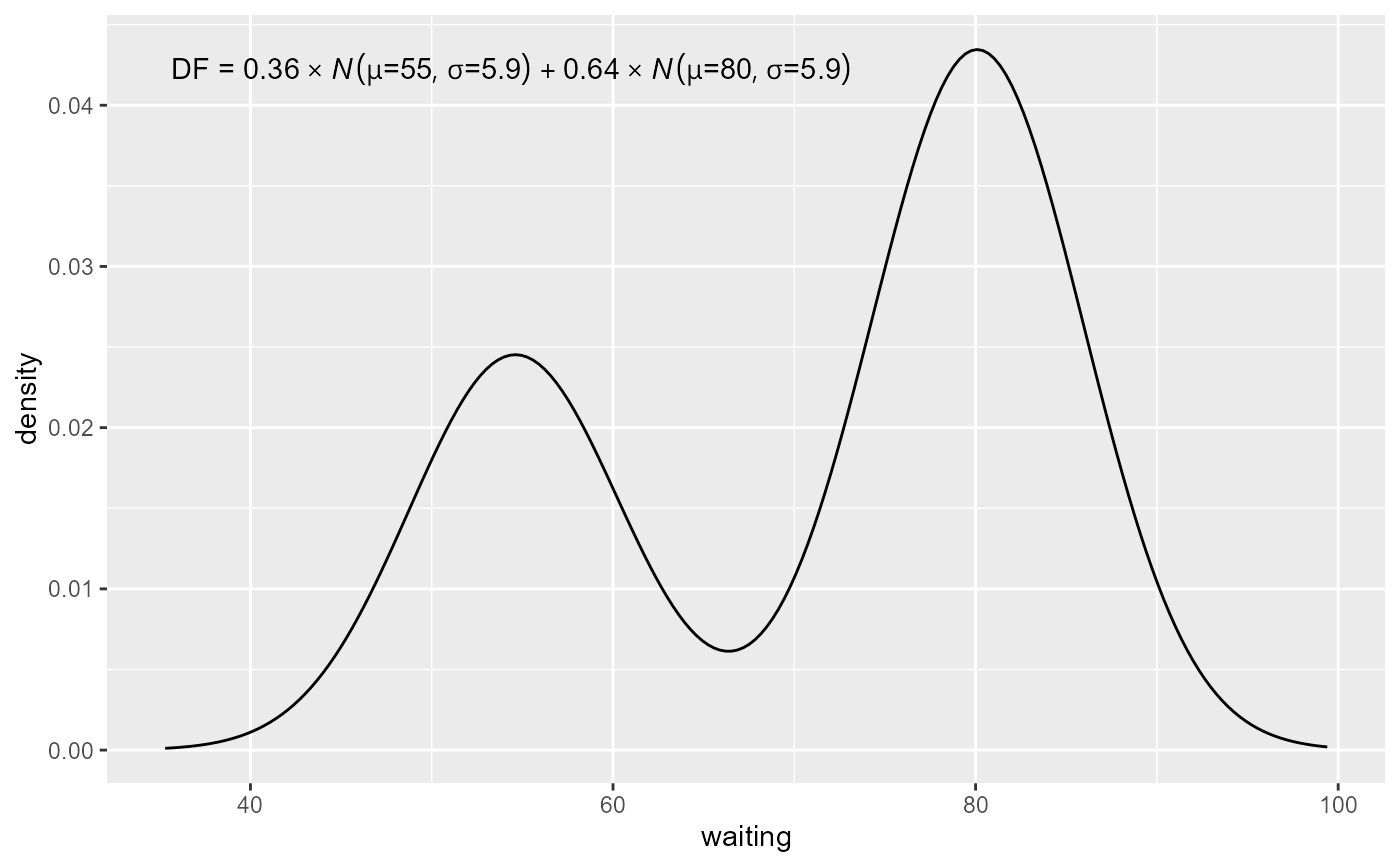
ggplot(faithful, aes(x = waiting)) +
stat_distrmix_line(components = "sum") +
stat_distrmix_eq()
 ggplot(faithful, aes(x = waiting)) +
stat_distrmix_line(components = "sum") +
stat_distrmix_eq(use_label("eq", "n", "method"))
ggplot(faithful, aes(x = waiting)) +
stat_distrmix_line(components = "sum") +
stat_distrmix_eq(use_label("eq", "n", "method"))
 ggplot(faithful, aes(x = waiting)) +
stat_distrmix_line(components = "sum") +
stat_distrmix_eq(geom = "label_npc")
ggplot(faithful, aes(x = waiting)) +
stat_distrmix_line(components = "sum") +
stat_distrmix_eq(geom = "label_npc")
 ggplot(faithful, aes(x = waiting)) +
stat_distrmix_line(components = "sum") +
stat_distrmix_eq(geom = "text", label.x = "center", label.y = "bottom")
ggplot(faithful, aes(x = waiting)) +
stat_distrmix_line(components = "sum") +
stat_distrmix_eq(geom = "text", label.x = "center", label.y = "bottom")
 ggplot(faithful, aes(x = waiting)) +
stat_distrmix_line(components = "sum") +
stat_distrmix_eq(geom = "text", hjust = "inward")
ggplot(faithful, aes(x = waiting)) +
stat_distrmix_line(components = "sum") +
stat_distrmix_eq(geom = "text", hjust = "inward")
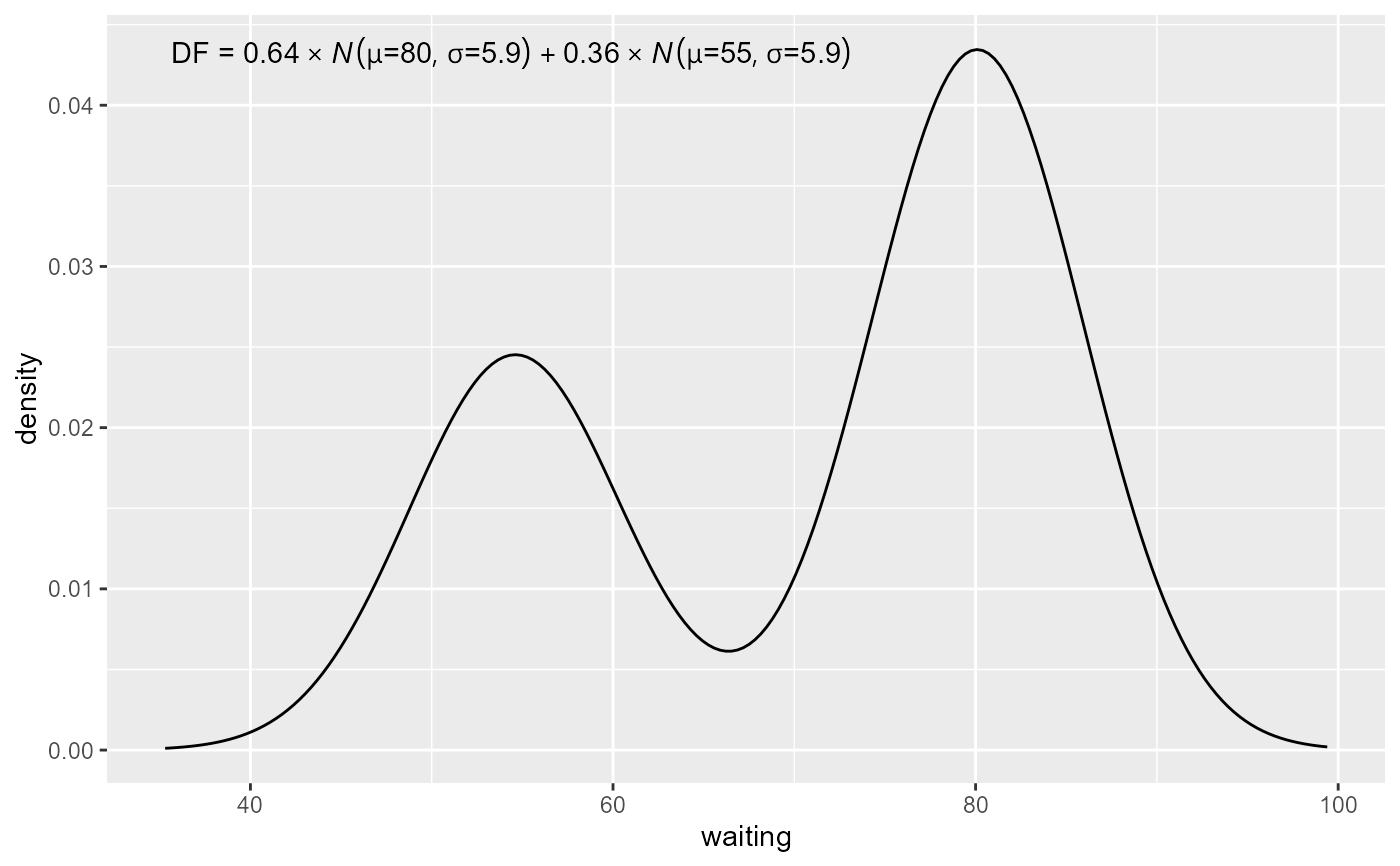 ggplot(faithful, aes(x = waiting)) +
stat_distrmix_line(components = "members") +
stat_distrmix_eq(components = "members")
ggplot(faithful, aes(x = waiting)) +
stat_distrmix_line(components = "members") +
stat_distrmix_eq(components = "members")
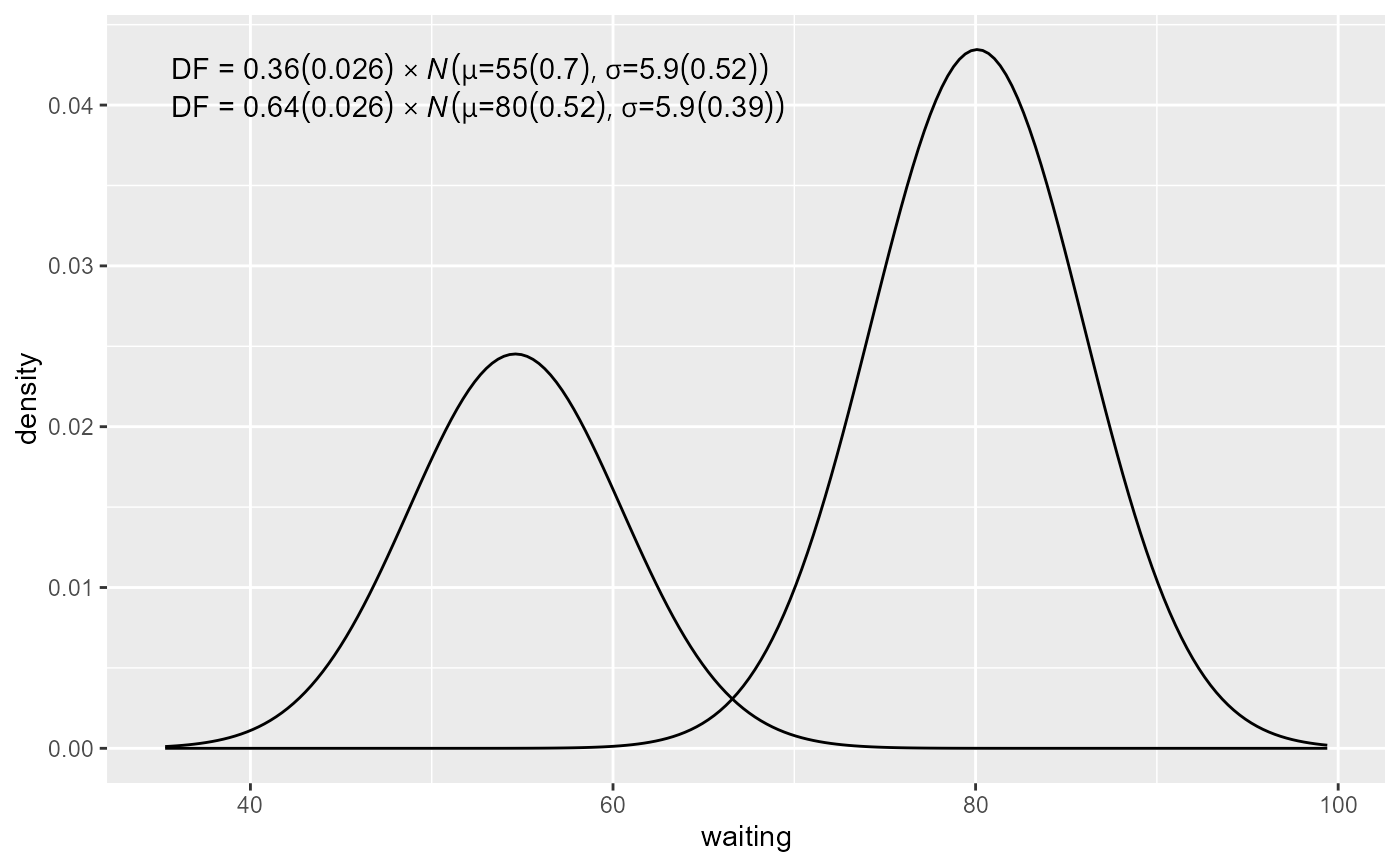
 ggplot(faithful, aes(x = waiting)) +
stat_distrmix_line(components = "members") +
stat_distrmix_eq(components = "members", se = TRUE)
ggplot(faithful, aes(x = waiting)) +
stat_distrmix_line(components = "members") +
stat_distrmix_eq(components = "members", se = TRUE)
 ggplot(faithful, aes(y = waiting)) +
stat_distrmix_line(components = "sum") +
stat_distrmix_eq(label.x = "right")
ggplot(faithful, aes(y = waiting)) +
stat_distrmix_line(components = "sum") +
stat_distrmix_eq(label.x = "right")
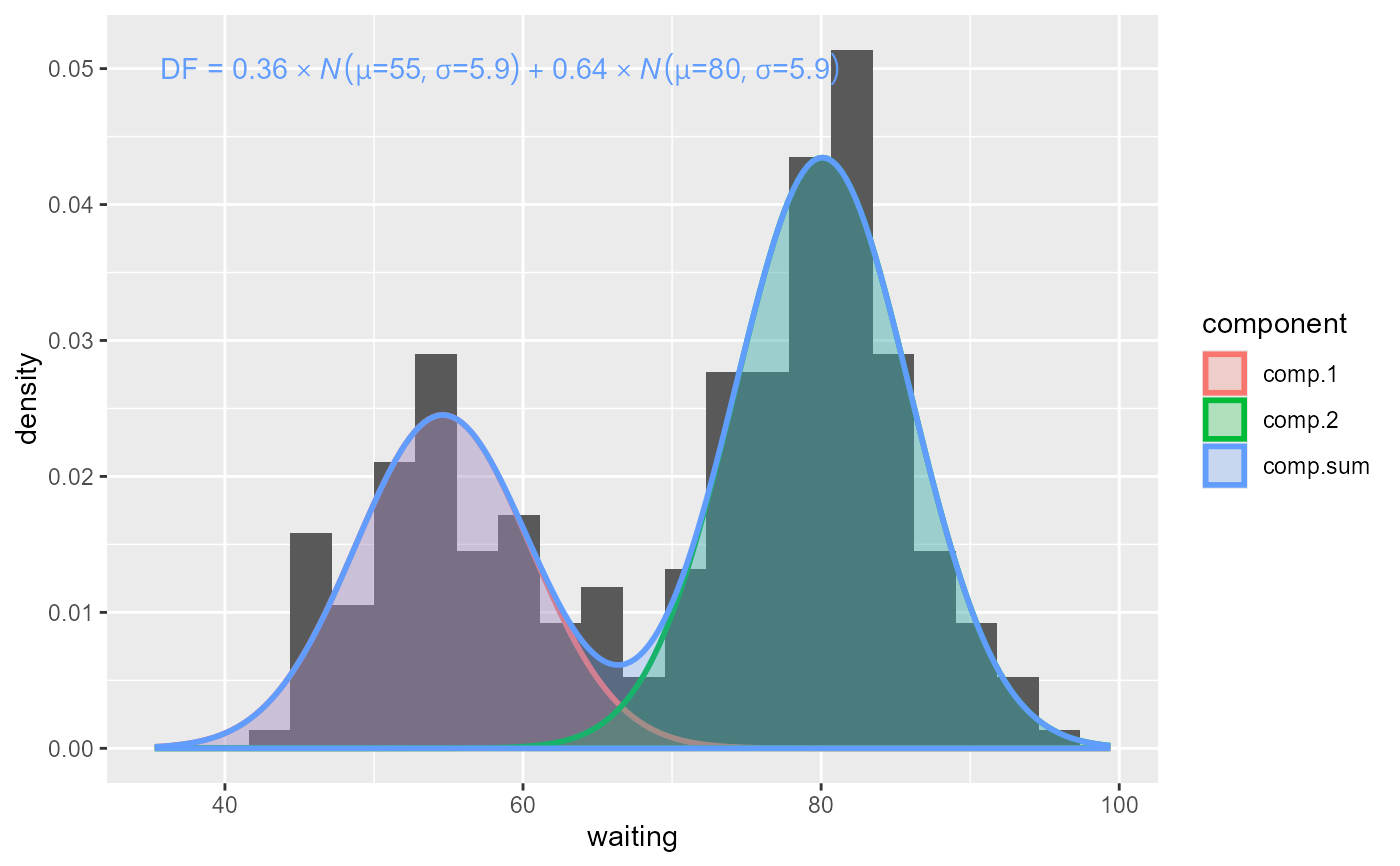 ggplot(faithful, aes(x = waiting)) +
geom_histogram(aes(y = after_stat(density)), bins = 20) +
stat_distrmix_line(aes(colour = after_stat(component),
fill = after_stat(component)),
geom = "area", linewidth = 1, alpha = 0.25) +
stat_distrmix_eq(aes(colour = after_stat(component)))
ggplot(faithful, aes(x = waiting)) +
geom_histogram(aes(y = after_stat(density)), bins = 20) +
stat_distrmix_line(aes(colour = after_stat(component),
fill = after_stat(component)),
geom = "area", linewidth = 1, alpha = 0.25) +
stat_distrmix_eq(aes(colour = after_stat(component)))
 ggplot(faithful, aes(x = waiting)) +
stat_distrmix_line(aes(colour = after_stat(component),
fill = after_stat(component)),
geom = "area", linewidth = 1, alpha = 0.25,
components = "members") +
stat_distrmix_eq(aes(colour = after_stat(component)),
components = "members")
ggplot(faithful, aes(x = waiting)) +
stat_distrmix_line(aes(colour = after_stat(component),
fill = after_stat(component)),
geom = "area", linewidth = 1, alpha = 0.25,
components = "members") +
stat_distrmix_eq(aes(colour = after_stat(component)),
components = "members")
 ggplot(faithful, aes(x = waiting)) +
stat_distrmix_line(geom = "area", linewidth = 1, alpha = 0.25,
colour = "black", outline.type = "upper",
components = "sum", se = FALSE) +
stat_distrmix_eq(components = "sum")
ggplot(faithful, aes(x = waiting)) +
stat_distrmix_line(geom = "area", linewidth = 1, alpha = 0.25,
colour = "black", outline.type = "upper",
components = "sum", se = FALSE) +
stat_distrmix_eq(components = "sum")
 # special case of no mixture
ggplot(subset(faithful, waiting > 66), aes(x = waiting)) +
stat_distrmix_line(k = 1) +
stat_distrmix_eq(k = 1)
#> With k = 1 one Normal distribution is fitted. Irrelevant parameters ignored!
#> With k = 1 one Normal distribution is fitted. Irrelevant parameters ignored!
# special case of no mixture
ggplot(subset(faithful, waiting > 66), aes(x = waiting)) +
stat_distrmix_line(k = 1) +
stat_distrmix_eq(k = 1)
#> With k = 1 one Normal distribution is fitted. Irrelevant parameters ignored!
#> With k = 1 one Normal distribution is fitted. Irrelevant parameters ignored!
 ggplot(subset(faithful, waiting > 66), aes(x = waiting)) +
stat_distrmix_line(k = 1) +
stat_distrmix_eq(k = 1, se = TRUE)
#> With k = 1 one Normal distribution is fitted. Irrelevant parameters ignored!
#> With k = 1 one Normal distribution is fitted. Irrelevant parameters ignored!
ggplot(subset(faithful, waiting > 66), aes(x = waiting)) +
stat_distrmix_line(k = 1) +
stat_distrmix_eq(k = 1, se = TRUE)
#> With k = 1 one Normal distribution is fitted. Irrelevant parameters ignored!
#> With k = 1 one Normal distribution is fitted. Irrelevant parameters ignored!
 # Inspecting the returned data using geom_debug_group()
gginnards.installed <- requireNamespace("gginnards", quietly = TRUE)
if (gginnards.installed)
library(gginnards)
if (gginnards.installed)
ggplot(faithful, aes(x = waiting)) +
stat_distrmix_line(geom = "debug_group", components = "all")
# Inspecting the returned data using geom_debug_group()
gginnards.installed <- requireNamespace("gginnards", quietly = TRUE)
if (gginnards.installed)
library(gginnards)
if (gginnards.installed)
ggplot(faithful, aes(x = waiting)) +
stat_distrmix_line(geom = "debug_group", components = "all")
 #> [1] "PANEL 1; group(s) comp.1; 'draw_function()' input 'data' (head):"
#> x component density flipped_aes PANEL group y
#> 2 35.29541 comp.1 0.0001092383 FALSE 1 comp.1 0.0001092383
#> 5 35.61754 comp.1 0.0001306554 FALSE 1 comp.1 0.0001306554
#> 8 35.93967 comp.1 0.0001558017 FALSE 1 comp.1 0.0001558017
#> 11 36.26180 comp.1 0.0001852294 FALSE 1 comp.1 0.0001852294
#> 14 36.58392 comp.1 0.0002195534 FALSE 1 comp.1 0.0002195534
#> 17 36.90605 comp.1 0.0002594557 FALSE 1 comp.1 0.0002594557
#> orientation
#> 2 NA
#> 5 NA
#> 8 NA
#> 11 NA
#> 14 NA
#> 17 NA
#> [1] "PANEL 1; group(s) comp.2; 'draw_function()' input 'data' (head):"
#> x component density flipped_aes PANEL group y
#> 3 35.29541 comp.2 9.599817e-15 FALSE 1 comp.2 9.599817e-15
#> 6 35.61754 comp.2 1.457556e-14 FALSE 1 comp.2 1.457556e-14
#> 9 35.93967 comp.2 2.206370e-14 FALSE 1 comp.2 2.206370e-14
#> 12 36.26180 comp.2 3.329836e-14 FALSE 1 comp.2 3.329836e-14
#> 15 36.58392 comp.2 5.010237e-14 FALSE 1 comp.2 5.010237e-14
#> 18 36.90605 comp.2 7.515967e-14 FALSE 1 comp.2 7.515967e-14
#> orientation
#> 3 NA
#> 6 NA
#> 9 NA
#> 12 NA
#> 15 NA
#> 18 NA
#> [1] "PANEL 1; group(s) comp.sum; 'draw_function()' input 'data' (head):"
#> x component density flipped_aes PANEL group y
#> 1 35.29541 comp.sum 0.0001092383 FALSE 1 comp.sum 0.0001092383
#> 4 35.61754 comp.sum 0.0001306554 FALSE 1 comp.sum 0.0001306554
#> 7 35.93967 comp.sum 0.0001558017 FALSE 1 comp.sum 0.0001558017
#> 10 36.26180 comp.sum 0.0001852294 FALSE 1 comp.sum 0.0001852294
#> 13 36.58392 comp.sum 0.0002195534 FALSE 1 comp.sum 0.0002195534
#> 16 36.90605 comp.sum 0.0002594557 FALSE 1 comp.sum 0.0002594557
#> orientation
#> 1 NA
#> 4 NA
#> 7 NA
#> 10 NA
#> 13 NA
#> 16 NA
stat_distrmix_eq(geom = "debug_group", components = "all")
#> geom_debug_group: na.rm = FALSE
#> stat_distrmix_eq: method = normalmixEM, method.name = normalmixEM, se = FALSE, fit.seed = NA, level = 0.95, method.args = list(), k = 2, free.mean = TRUE, free.sd = TRUE, components = all, n.min = 20, eq.with.lhs = TRUE, eq.digits = 2, label.x = left, label.y = top, hstep = 0, vstep = 0.05, npc.used = FALSE, output.type = expression, na.rm = FALSE, orientation = NA, parse = TRUE
#> position_identity
if (gginnards.installed)
ggplot(faithful, aes(x = waiting)) +
stat_distrmix_eq(geom = "debug_group", components = "sum")
#> [1] "PANEL 1; group(s) comp.1; 'draw_function()' input 'data' (head):"
#> x component density flipped_aes PANEL group y
#> 2 35.29541 comp.1 0.0001092383 FALSE 1 comp.1 0.0001092383
#> 5 35.61754 comp.1 0.0001306554 FALSE 1 comp.1 0.0001306554
#> 8 35.93967 comp.1 0.0001558017 FALSE 1 comp.1 0.0001558017
#> 11 36.26180 comp.1 0.0001852294 FALSE 1 comp.1 0.0001852294
#> 14 36.58392 comp.1 0.0002195534 FALSE 1 comp.1 0.0002195534
#> 17 36.90605 comp.1 0.0002594557 FALSE 1 comp.1 0.0002594557
#> orientation
#> 2 NA
#> 5 NA
#> 8 NA
#> 11 NA
#> 14 NA
#> 17 NA
#> [1] "PANEL 1; group(s) comp.2; 'draw_function()' input 'data' (head):"
#> x component density flipped_aes PANEL group y
#> 3 35.29541 comp.2 9.599817e-15 FALSE 1 comp.2 9.599817e-15
#> 6 35.61754 comp.2 1.457556e-14 FALSE 1 comp.2 1.457556e-14
#> 9 35.93967 comp.2 2.206370e-14 FALSE 1 comp.2 2.206370e-14
#> 12 36.26180 comp.2 3.329836e-14 FALSE 1 comp.2 3.329836e-14
#> 15 36.58392 comp.2 5.010237e-14 FALSE 1 comp.2 5.010237e-14
#> 18 36.90605 comp.2 7.515967e-14 FALSE 1 comp.2 7.515967e-14
#> orientation
#> 3 NA
#> 6 NA
#> 9 NA
#> 12 NA
#> 15 NA
#> 18 NA
#> [1] "PANEL 1; group(s) comp.sum; 'draw_function()' input 'data' (head):"
#> x component density flipped_aes PANEL group y
#> 1 35.29541 comp.sum 0.0001092383 FALSE 1 comp.sum 0.0001092383
#> 4 35.61754 comp.sum 0.0001306554 FALSE 1 comp.sum 0.0001306554
#> 7 35.93967 comp.sum 0.0001558017 FALSE 1 comp.sum 0.0001558017
#> 10 36.26180 comp.sum 0.0001852294 FALSE 1 comp.sum 0.0001852294
#> 13 36.58392 comp.sum 0.0002195534 FALSE 1 comp.sum 0.0002195534
#> 16 36.90605 comp.sum 0.0002594557 FALSE 1 comp.sum 0.0002594557
#> orientation
#> 1 NA
#> 4 NA
#> 7 NA
#> 10 NA
#> 13 NA
#> 16 NA
stat_distrmix_eq(geom = "debug_group", components = "all")
#> geom_debug_group: na.rm = FALSE
#> stat_distrmix_eq: method = normalmixEM, method.name = normalmixEM, se = FALSE, fit.seed = NA, level = 0.95, method.args = list(), k = 2, free.mean = TRUE, free.sd = TRUE, components = all, n.min = 20, eq.with.lhs = TRUE, eq.digits = 2, label.x = left, label.y = top, hstep = 0, vstep = 0.05, npc.used = FALSE, output.type = expression, na.rm = FALSE, orientation = NA, parse = TRUE
#> position_identity
if (gginnards.installed)
ggplot(faithful, aes(x = waiting)) +
stat_distrmix_eq(geom = "debug_group", components = "sum")
 #> [1] "PANEL 1; group(s) comp.sum; 'draw_function()' input 'data' (head):"
#> lambda mu sigma k converged n fm.class fm.method component
#> 1 1 NA NA NA TRUE 272 mixEM normalmixEM comp.sum
#> eq.label
#> 1 DF~`=`~0.36 %*% italic(N)(mu*`=`*55, sigma*`=`*5.9) + 0.64 %*% italic(N)(mu*`=`*80, sigma*`=`*5.9)
#> n.label method.label npcx npcy PANEL group
#> 1 n~`=`~272 "method: normalmixEM" NA NA 1 comp.sum
#> label
#> 1 DF~`=`~0.36 %*% italic(N)(mu*`=`*55, sigma*`=`*5.9) + 0.64 %*% italic(N)(mu*`=`*80, sigma*`=`*5.9)
#> x y orientation
#> 1 0.05 0.95 NA
if (gginnards.installed)
ggplot(faithful, aes(x = waiting)) +
stat_distrmix_eq(geom = "debug_group", components = "members")
#> [1] "PANEL 1; group(s) comp.sum; 'draw_function()' input 'data' (head):"
#> lambda mu sigma k converged n fm.class fm.method component
#> 1 1 NA NA NA TRUE 272 mixEM normalmixEM comp.sum
#> eq.label
#> 1 DF~`=`~0.36 %*% italic(N)(mu*`=`*55, sigma*`=`*5.9) + 0.64 %*% italic(N)(mu*`=`*80, sigma*`=`*5.9)
#> n.label method.label npcx npcy PANEL group
#> 1 n~`=`~272 "method: normalmixEM" NA NA 1 comp.sum
#> label
#> 1 DF~`=`~0.36 %*% italic(N)(mu*`=`*55, sigma*`=`*5.9) + 0.64 %*% italic(N)(mu*`=`*80, sigma*`=`*5.9)
#> x y orientation
#> 1 0.05 0.95 NA
if (gginnards.installed)
ggplot(faithful, aes(x = waiting)) +
stat_distrmix_eq(geom = "debug_group", components = "members")
 #> [1] "PANEL 1; group(s) comp.1; 'draw_function()' input 'data' (head):"
#> lambda mu sigma k converged n fm.class fm.method component
#> 1 0.3608869 54.61489 5.871242 2 TRUE 272 mixEM normalmixEM comp.1
#> eq.label n.label
#> 1 DF~`=`~0.36 %*% italic(N)(mu*`=`*55, sigma*`=`*5.9) n~`=`~272
#> method.label npcx x npcy PANEL group
#> 1 "method: normalmixEM" NA 0.05 NA 1 comp.1
#> label y orientation
#> 1 DF~`=`~0.36 %*% italic(N)(mu*`=`*55, sigma*`=`*5.9) 0.95 NA
#> [1] "PANEL 1; group(s) comp.2; 'draw_function()' input 'data' (head):"
#> lambda mu sigma k converged n fm.class fm.method component
#> 2 0.6391131 80.09109 5.867718 2 TRUE 272 mixEM normalmixEM comp.2
#> eq.label n.label
#> 2 DF~`=`~0.64 %*% italic(N)(mu*`=`*80, sigma*`=`*5.9) n~`=`~272
#> method.label npcx x npcy PANEL group
#> 2 "method: normalmixEM" NA 0.05 NA 1 comp.2
#> label y orientation
#> 2 DF~`=`~0.64 %*% italic(N)(mu*`=`*80, sigma*`=`*5.9) 0.9 NA
if (gginnards.installed)
ggplot(faithful, aes(x = waiting)) +
stat_distrmix_eq(geom = "debug_group",
components = "members",
fm.values = TRUE)
#> [1] "PANEL 1; group(s) comp.1; 'draw_function()' input 'data' (head):"
#> lambda mu sigma k converged n fm.class fm.method component
#> 1 0.3608869 54.61489 5.871242 2 TRUE 272 mixEM normalmixEM comp.1
#> eq.label n.label
#> 1 DF~`=`~0.36 %*% italic(N)(mu*`=`*55, sigma*`=`*5.9) n~`=`~272
#> method.label npcx x npcy PANEL group
#> 1 "method: normalmixEM" NA 0.05 NA 1 comp.1
#> label y orientation
#> 1 DF~`=`~0.36 %*% italic(N)(mu*`=`*55, sigma*`=`*5.9) 0.95 NA
#> [1] "PANEL 1; group(s) comp.2; 'draw_function()' input 'data' (head):"
#> lambda mu sigma k converged n fm.class fm.method component
#> 2 0.6391131 80.09109 5.867718 2 TRUE 272 mixEM normalmixEM comp.2
#> eq.label n.label
#> 2 DF~`=`~0.64 %*% italic(N)(mu*`=`*80, sigma*`=`*5.9) n~`=`~272
#> method.label npcx x npcy PANEL group
#> 2 "method: normalmixEM" NA 0.05 NA 1 comp.2
#> label y orientation
#> 2 DF~`=`~0.64 %*% italic(N)(mu*`=`*80, sigma*`=`*5.9) 0.9 NA
if (gginnards.installed)
ggplot(faithful, aes(x = waiting)) +
stat_distrmix_eq(geom = "debug_group",
components = "members",
fm.values = TRUE)
 #> [1] "PANEL 1; group(s) comp.1; 'draw_function()' input 'data' (head):"
#> lambda mu sigma k converged n fm.class fm.method component
#> 1 0.3608873 54.61491 5.871254 2 TRUE 272 mixEM normalmixEM comp.1
#> eq.label n.label
#> 1 DF~`=`~0.36 %*% italic(N)(mu*`=`*55, sigma*`=`*5.9) n~`=`~272
#> method.label npcx x npcy PANEL group
#> 1 "method: normalmixEM" NA 0.05 NA 1 comp.1
#> label y orientation
#> 1 DF~`=`~0.36 %*% italic(N)(mu*`=`*55, sigma*`=`*5.9) 0.95 NA
#> [1] "PANEL 1; group(s) comp.2; 'draw_function()' input 'data' (head):"
#> lambda mu sigma k converged n fm.class fm.method component
#> 2 0.6391127 80.0911 5.867709 2 TRUE 272 mixEM normalmixEM comp.2
#> eq.label n.label
#> 2 DF~`=`~0.64 %*% italic(N)(mu*`=`*80, sigma*`=`*5.9) n~`=`~272
#> method.label npcx x npcy PANEL group
#> 2 "method: normalmixEM" NA 0.05 NA 1 comp.2
#> label y orientation
#> 2 DF~`=`~0.64 %*% italic(N)(mu*`=`*80, sigma*`=`*5.9) 0.9 NA
#> [1] "PANEL 1; group(s) comp.1; 'draw_function()' input 'data' (head):"
#> lambda mu sigma k converged n fm.class fm.method component
#> 1 0.3608873 54.61491 5.871254 2 TRUE 272 mixEM normalmixEM comp.1
#> eq.label n.label
#> 1 DF~`=`~0.36 %*% italic(N)(mu*`=`*55, sigma*`=`*5.9) n~`=`~272
#> method.label npcx x npcy PANEL group
#> 1 "method: normalmixEM" NA 0.05 NA 1 comp.1
#> label y orientation
#> 1 DF~`=`~0.36 %*% italic(N)(mu*`=`*55, sigma*`=`*5.9) 0.95 NA
#> [1] "PANEL 1; group(s) comp.2; 'draw_function()' input 'data' (head):"
#> lambda mu sigma k converged n fm.class fm.method component
#> 2 0.6391127 80.0911 5.867709 2 TRUE 272 mixEM normalmixEM comp.2
#> eq.label n.label
#> 2 DF~`=`~0.64 %*% italic(N)(mu*`=`*80, sigma*`=`*5.9) n~`=`~272
#> method.label npcx x npcy PANEL group
#> 2 "method: normalmixEM" NA 0.05 NA 1 comp.2
#> label y orientation
#> 2 DF~`=`~0.64 %*% italic(N)(mu*`=`*80, sigma*`=`*5.9) 0.9 NA