stat_fit_tidy() fits a model and returns a "tidy" version
of the model's summary, using tidy() method specializations from
packages 'broom', 'broom.mixed', or other sources.
Usage
stat_fit_tidy(
  mapping = NULL,
  data = NULL,
  geom = "text_npc",
  position = "identity",
  ...,
  method = "lm",
  method.args = list(formula = y ~ x),
  n.min = 2L,
  fit.seed = NA,
  tidy.args = list(),
  label.x = "left",
  label.y = "top",
  hstep = 0,
  vstep = NULL,
  sanitize.names = FALSE,
  na.rm = FALSE,
  show.legend = FALSE,
  inherit.aes = TRUE
)
Arguments
- mapping
The aesthetic mapping, usually constructed with
aes(). Only needs to be set at the layer level if you are overriding the plot defaults.- data
A layer specific dataset, only needed if you want to override the plot defaults.
- geom
The geometric object to use display the data
- position
The position adjustment to use for overlapping points on this layer.
- ...
other arguments passed on to
layer. This can include aesthetics whose values you want to set, not map. Seelayerfor more details.- method
function or character If character, "lm", "rlm", "lmrob", "lts", "gls", "ma", "sma", "segreg", "rq" or the name of a model fit function are accepted, possibly followed by the fit function's
methodargument separated by a colon (e.g."rlm:M"). If a function is different tolm(),rlm(),ltsReg(),gls(),ma,sma, it must have formal parameters namedformula,data, andweights. See Details.- method.args, tidy.args
list of arguments to pass to
method, and to [generics::tidy], respectively.- n.min
integer Minimum number of distinct values in the explanatory variable (on the rhs of formula) for fitting to the attempted.
- fit.seed
RNG seed argument passed to
set.seed(). Defaults toNA, indicating thatset.seed()should not be called.- label.x, label.y
numericwith range 0..1 "normalized parent coordinates" (npc units) or character if usinggeom_text_npc()orgeom_label_npc(). If usinggeom_text()orgeom_label()numeric in native data units. If too short they will be recycled.- hstep, vstep
numeric in npc units, the horizontal and vertical step used between labels for different groups.
- sanitize.names
logical If true sanitize column names in the returned
datawith R'smake.names()function.- na.rm
a logical indicating whether NA values should be stripped before the computation proceeds.
- show.legend
logical. Should this layer be included in the legends?
NA, the default, includes if any aesthetics are mapped.FALSEnever includes, andTRUEalways includes.- inherit.aes
If
FALSE, overrides the default aesthetics, rather than combining with them. This is most useful for helper functions that define both data and aesthetics and shouldn't inherit behaviour from the default plot specification, e.g.borders.
Value
The output of tidy() is returned after reshaping it into a
single row. Grouping is respected, and the model fitted separately to each
group of data. The returned data object has one row for each group
within a panel. To use the intercept, note that output of tidy() is
renamed from (Intercept) to Intercept. Otherwise, the names
of the columns in the returned data are based on those returned by the
tidy() method for the model fit class returned by the fit function.
These will frequently differ from the name of values returned by the print
methods corresponding to the fit or test function used. To explore the
values returned by this statistic including the name of variables/columns,
which vary depending on the model fitting function and model formula, we
suggest the use of geom_debug. An example is shown
below. Names of columns as returned by default are not always syntactically
valid R names making it necessary to use back ticks to access them.
Syntactically valid names are guaranteed if sanitize.names = TRUE is
added to the call.
To explore the values returned by this statistic, which vary depending on
the model fitting function and model formula we suggest the use of
geom_debug. An example is shown below.
Details
stat_fit_tidy together with stat_fit_glance
and stat_fit_augment, based on package 'broom' can be used
with a broad range of model fitting functions as supported at any given
time by 'broom'. In contrast to stat_poly_eq which can
generate text or expression labels automatically, for these functions the
mapping of aesthetic label needs to be explicitly supplied in the
call, and labels built on the fly.
Although arguments passed to parameter tidy.args will be passed
to tidy() whether they are silently ignored or
obeyed depends on each specialization of tidy(), so do carefully
read the documentation for the version of tidy() corresponding to
the method used to fit the model. You will also need to manually
install the package, such as 'broom', where the tidier you intend to use
are defined.
Warning! Not all tidy() methods are defined in package
'broom'. glance() specializations for mixed models fits of classes
"lme", "nlme", "lme4" and many others are defined in
package 'broom.mixed'.
Handling of grouping
stat_fit_tidy applies the function
given by method separately to each group of observations; in ggplot2
factors mapped to aesthetics generate a separate group for each level.
Because of this, stat_fit_tidy is not useful for annotating plots
with results from t.test() or ANOVA or ANCOVA. In such cases use
instead stat_fit_tb() which applies the model fitting per panel.
Model formula and model fitting
A ggplot statistic receives as data a data frame that is not the one
passed as argument by the user, but instead a data frame with the variables
mapped to aesthetics. In stat_poly_eq() the compute function is
applied by group, each call "seeing" the subset of data for an
individual group. As supported models are for regression lines,
variables mapped to x and y should both be continuous, i.e.,
numeric or date time and model formulas defined using x and y
as variable names.
The interpretation of the argument passed to formula is enhanced
compared to stat_smooth(). Formulas with x as explanatory
variable work as in stat_smooth() but formulas with y as
explanatory variable are also accepted. orientation is set
automatically based on which explanatory variable appears in the formula.
Spline-based smoothers are only partially supported.
Model fit methods supported
Several model fit functions are supported explicitly (see tables), and some
of their differences smoothed out. Compatibility is checked late, based on
the class of the returned fitted model object. This makes it possible to
use wrapper functions that do model selection or other adjustments to the
fit procedure on a per panel or per group basis. Moreover, if the value
returned as model fit object is NULL or NA, plotting is
skipped on a per group within panel basis.
In the case of fitted model objects of classes not explicitly supported, an attempt is made to find the usual accessors and/or fitted object members, and if found, either complete or partial support is frequently achieved. In this case a message is issued encouraging users to check the validity of the values extracted as the structure of fitted model objects belonging to different classes and the values returned by their accessors can vary, potentially resulting in decoding errors leading to the return of wrong values for estimates.
The argument to parameter method can be either the name of a
function object, possibly using double colon notation in case its package
is not attached, or a character string matching the function name for
functions in the search path. This approach makes it possible to support
model fit functions that are not dependencies of 'ggpmisc'. Either by
attaching the package where the function is defined and passing it by name
or as string, or using double colon notation when passing the name of the
function.
User-defined functions can be passed as argument to parameter method
as long as they have parameters formula, data subset
and possibly weights. Additional arguments can be passed to any
method as a named list through parameter method.args. As in
stat_smooth() prior weights are
passed to the model fit functions' weights (plural!) parameter by
mapping a numeric variable to plot aesthetic weight (singular!).
Tables 1 lists natively supported model fit functions, with the caveat that only some 'broom' methods' specializations have been actually tested with statistics from 'ggpmisc'. In addition, the statistics based on 'broom' methods require the user to tailor their behaviour by passing additional arguments in the call and occasionally some detective work to find out the names of variables in the returned data frame as these names are set by methods from 'broom'.
Table 1. Model fit methods supported by the different statistics available in package 'ggpmisc'. Column \(f\) indicates whether computations are done by group (G) or by plot panel (P).
| Statistic | \(f\) | Supported model fit methods |
stat_poly_line() | G | "lm", "rlm", "lts", "sma", "ma", "gls", others with methods predict() or fitted() |
stat_poly_eq() | G | "lm", "rlm", "lts", "sma", "ma", "gls", others with needed accesors |
stat_quant_line() | G | "rq", "rqss" |
stat_quant_band() | G | "rq", "rqss" |
stat_quant_eq() | G | "rq", "rqss" |
stat_ma_line() | G | "SMA", "MA", "RMA", "OLS" |
stat_ma_eq() | G | "SMA", "MA", "RMA", "OLS" |
stat_fit_residuals() | G | "lm", "rlm", "lts", "sma", "ma", "gls", "rq", "rqss" others with method residuals() |
stat_fit_fitted() | G | "lm", "rlm", "lts", "gls", "rq", "rqss" others with method fitted() |
stat_fit_deviations() | G | "lm", "rlm", "lts", "gls", "rq", "rqss" others with methods fitted() and weights() |
stat_fit_augment() | G | any with 'broom' method augment() |
stat_fit_glance() | G | any with 'broom' method glance() |
stat_fit_tidy() | G | any with 'broom' method tidy() |
stat_fit_tb() | P | any with 'broom' method tidy() |
The single colon notation is based on parsing
the name and is available when passing the name of the fit method as a
character string. In a string such as "head:tail" the "head" gives the name
of the model fit function and the "tail" gives the argument to pass it's
method parameter. This is only a convenience, as method.args
can be also used. In some methods, i.e., splines, the default
formula = y ~ x needs to be overridden by the user.
Table 2 lists the correspondence of pre-defined method names to model fit method functions. As mentioned above, these are only a subset of the model fit methods that are expected to work. When using these names there is no need for users to attach additional packages but the packages must be available (installed).
Table 2. Available predefined method names, the model fit functions
they call, the packages where the functions reside, the class of the
returned fitted model object and the arguments that can be
passed to their method parameter using single colon notation.
| Predefined method names | Model fit methods | R package | Object class |
| "lm", "lm:qr" | lm() | 'stats' | "lm" |
| "rlm", "rlm:M", "rlm:MM" | rlm() | 'MASS' | "rlm" ("lm") |
| "lts", "ltsReg" | ltsReg() | 'robustbase' | "lts" |
| "ma", "sma", "sma:SMA", "sma:MA", "sma:OLS" | sma() | 'smatr' | "ma" or "sma" |
| "gls", "gls:REML", "gls:ML" | gls() | 'nlme' | "gls" |
| "rq", "rq:sfn", "rq:sfnc", "rq:lasso" | rq() | 'quantreg' | "rq" |
| "rqss", "rqss:sfn", "rqss:sfnc", "rqss:lasso" | rqss() | 'quantreg' | "rqss" |
| "SMA", "MA", "RMA", "OLS" | lmodel2() | 'lmodel2' | ("list") |
See also
Package broom for details on how the tidying of
the result of model fits is done.
Other 'ggpmisc' statistics for model fits:
stat_distrmix_eq(),
stat_fit_deviations(),
stat_fit_glance(),
stat_fit_tb(),
stat_ma_eq(),
stat_poly_eq(),
stat_quant_band()
Aesthetics
stat_fit_tidy() understands the following aesthetics. Required aesthetics are displayed in bold and defaults are displayed for optional aesthetics:
| • | x | |
| • | y | |
| • | group | → inferred |
| • | hjust | → "inward" |
| • | npcx | → after_stat(npcx) |
| • | npcy | → after_stat(npcy) |
| • | vjust | → "inward" |
Learn more about setting these aesthetics in vignette("ggplot2-specs").
Examples
# Package 'broom' needs to be installed to run these examples.
# We check availability before running them to avoid errors.
broom.installed <- requireNamespace("broom", quietly = TRUE)
gginnards.installed <- requireNamespace("gginnards", quietly = TRUE)
if (broom.installed) {
library(broom)
}
# Inspecting the returned data using geom_debug_group()
if (gginnards.installed) {
library(gginnards)
}
# Regression by panel, inspecting data
if (broom.installed && gginnards.installed) {
# Regression by panel, default column names
ggplot(mtcars, aes(x = disp, y = mpg)) +
stat_smooth(method = "lm", formula = y ~ x + I(x^2)) +
geom_point(aes(colour = factor(cyl))) +
stat_fit_tidy(method = "lm",
method.args = list(formula = y ~ x + I(x^2)),
geom = "debug_group")
# Regression by panel, sanitized column names
ggplot(mtcars, aes(x = disp, y = mpg)) +
stat_smooth(method = "lm", formula = y ~ x + I(x^2)) +
geom_point(aes(colour = factor(cyl))) +
stat_fit_tidy(method = "lm",
method.args = list(formula = y ~ x + I(x^2)),
geom = "debug_group", sanitize.names = TRUE)
}
 #> [1] "PANEL 1; group(s) -1; 'draw_function()' input 'data' (head):"
#> Intercept_estimate x_estimate I.x.2._estimate Intercept_se x_se
#> 1 35.8287 -0.1052732 0.0001255373 2.208819 0.0202769
#> I.x.2._se Intercept_stat x_stat I.x.2._stat Intercept_p.value
#> 1 3.891214e-05 16.22075 -5.191783 3.226172 4.389937e-16
#> x_p.value I.x.2._p.value x npcx y npcy fm.class fm.method
#> 1 1.488465e-05 0.003103547 91.145 NA 32.725 NA lm lm
#> fm.formula fm.formula.chr PANEL group
#> 1 y ~ x + I(x^2) y ~ x + I(x^2) 1 -1
# Regression by panel example
if (broom.installed)
ggplot(mtcars, aes(x = disp, y = mpg)) +
stat_smooth(method = "lm", formula = y ~ x) +
geom_point(aes(colour = factor(cyl))) +
stat_fit_tidy(method = "lm",
label.x = "right",
method.args = list(formula = y ~ x),
mapping = aes(label = sprintf("Slope = %.3g\np-value = %.3g",
after_stat(x_estimate),
after_stat(x_p.value))))
#> [1] "PANEL 1; group(s) -1; 'draw_function()' input 'data' (head):"
#> Intercept_estimate x_estimate I.x.2._estimate Intercept_se x_se
#> 1 35.8287 -0.1052732 0.0001255373 2.208819 0.0202769
#> I.x.2._se Intercept_stat x_stat I.x.2._stat Intercept_p.value
#> 1 3.891214e-05 16.22075 -5.191783 3.226172 4.389937e-16
#> x_p.value I.x.2._p.value x npcx y npcy fm.class fm.method
#> 1 1.488465e-05 0.003103547 91.145 NA 32.725 NA lm lm
#> fm.formula fm.formula.chr PANEL group
#> 1 y ~ x + I(x^2) y ~ x + I(x^2) 1 -1
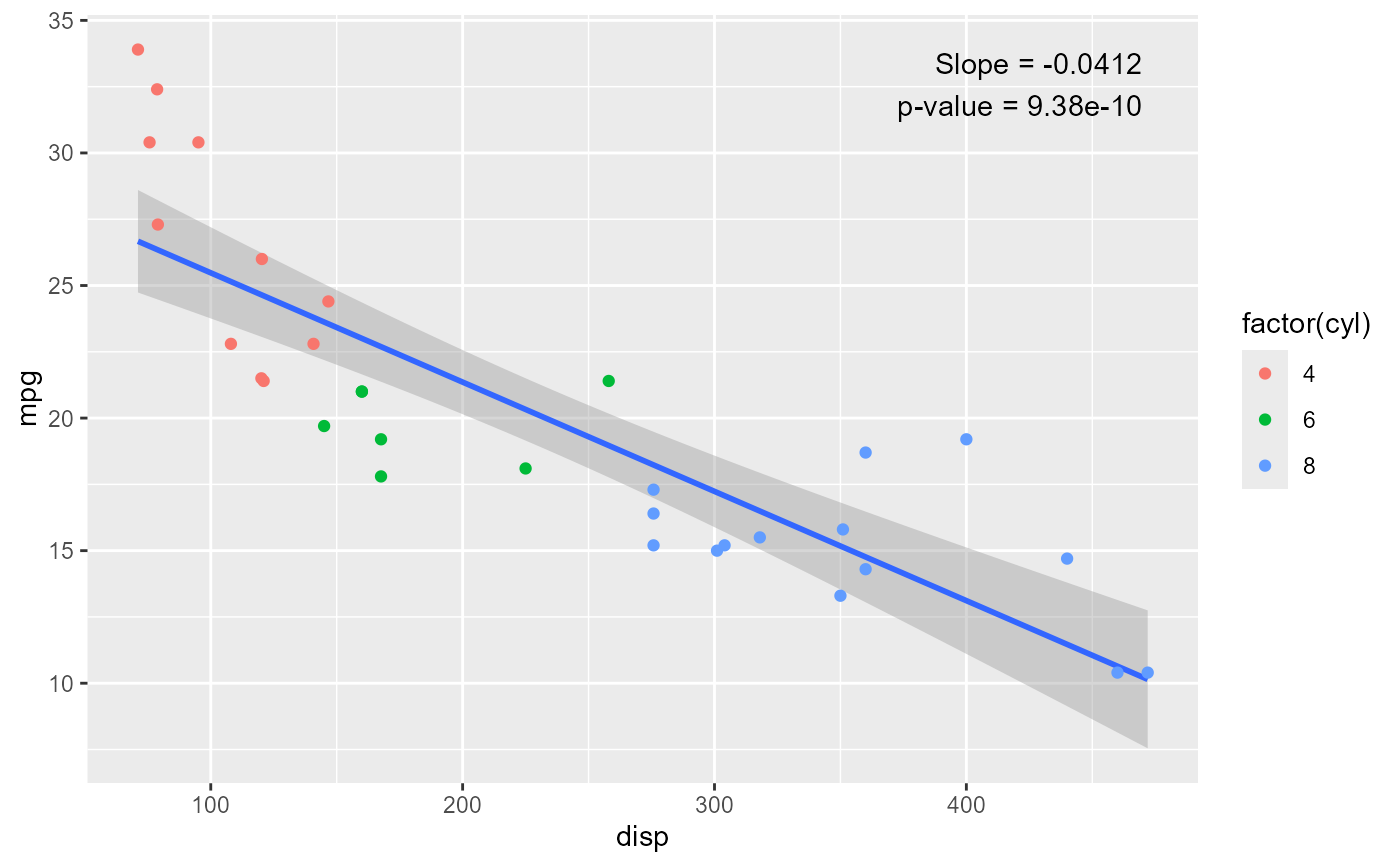
# Regression by panel example
if (broom.installed)
ggplot(mtcars, aes(x = disp, y = mpg)) +
stat_smooth(method = "lm", formula = y ~ x) +
geom_point(aes(colour = factor(cyl))) +
stat_fit_tidy(method = "lm",
label.x = "right",
method.args = list(formula = y ~ x),
mapping = aes(label = sprintf("Slope = %.3g\np-value = %.3g",
after_stat(x_estimate),
after_stat(x_p.value))))
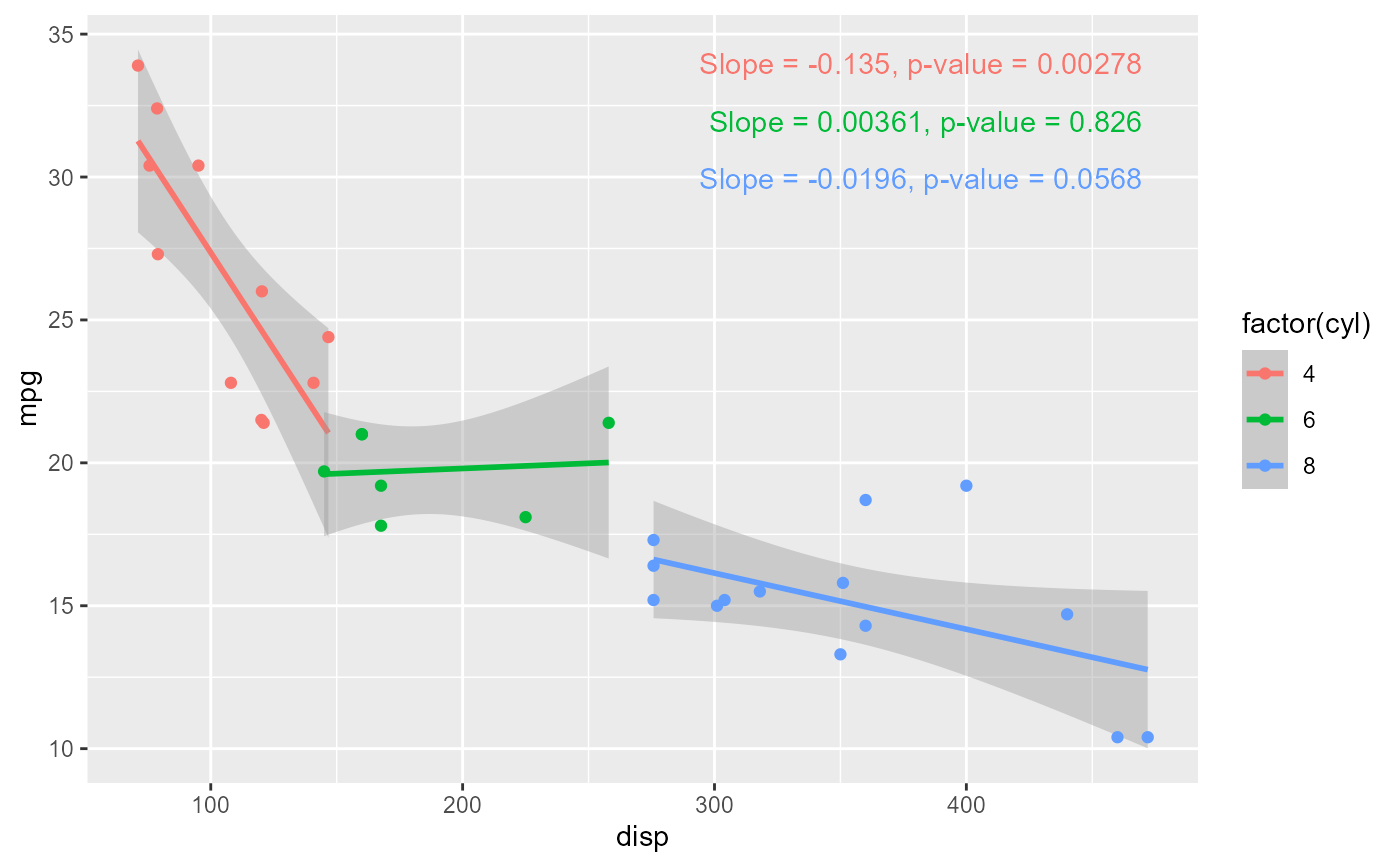
 # Regression by group example
if (broom.installed)
ggplot(mtcars, aes(x = disp, y = mpg, colour = factor(cyl))) +
stat_smooth(method = "lm", formula = y ~ x) +
geom_point() +
stat_fit_tidy(method = "lm",
label.x = "right",
method.args = list(formula = y ~ x),
mapping = aes(label = sprintf("Slope = %.3g, p-value = %.3g",
after_stat(x_estimate),
after_stat(x_p.value))))
# Regression by group example
if (broom.installed)
ggplot(mtcars, aes(x = disp, y = mpg, colour = factor(cyl))) +
stat_smooth(method = "lm", formula = y ~ x) +
geom_point() +
stat_fit_tidy(method = "lm",
label.x = "right",
method.args = list(formula = y ~ x),
mapping = aes(label = sprintf("Slope = %.3g, p-value = %.3g",
after_stat(x_estimate),
after_stat(x_p.value))))
 # Weighted regression example
if (broom.installed)
ggplot(mtcars, aes(x = disp, y = mpg, weight = cyl)) +
stat_smooth(method = "lm", formula = y ~ x) +
geom_point(aes(colour = factor(cyl))) +
stat_fit_tidy(method = "lm",
label.x = "right",
method.args = list(formula = y ~ x, weights = quote(weight)),
mapping = aes(label = sprintf("Slope = %.3g\np-value = %.3g",
after_stat(x_estimate),
after_stat(x_p.value))))
# Weighted regression example
if (broom.installed)
ggplot(mtcars, aes(x = disp, y = mpg, weight = cyl)) +
stat_smooth(method = "lm", formula = y ~ x) +
geom_point(aes(colour = factor(cyl))) +
stat_fit_tidy(method = "lm",
label.x = "right",
method.args = list(formula = y ~ x, weights = quote(weight)),
mapping = aes(label = sprintf("Slope = %.3g\np-value = %.3g",
after_stat(x_estimate),
after_stat(x_p.value))))
