stat_fit_tb() fits a model and returns a "tidy" version of
the model's summary or ANOVA table, using 'tidy() methods from
packages 'broom', 'broom.mixed', or other 'broom' extensions. The
annotation is added to the plots in tabular form.
Usage
stat_fit_tb(
  mapping = NULL,
  data = NULL,
  geom = "table_npc",
  position = "identity",
  ...,
  method = "lm",
  method.args = list(formula = y ~ x),
  n.min = 2L,
  fit.seed = NA,
  tidy.args = list(),
  tb.type = "fit.summary",
  tb.vars = NULL,
  tb.params = NULL,
  digits = 3,
  p.digits = digits,
  label.x = "center",
  label.y = "top",
  table.theme = NULL,
  table.rownames = FALSE,
  table.colnames = TRUE,
  table.hjust = 1,
  parse = FALSE,
  na.rm = FALSE,
  show.legend = FALSE,
  inherit.aes = TRUE
)
Arguments
- mapping
The aesthetic mapping, usually constructed with
aes(). Only needs to be set at the layer level if you are overriding the plot defaults.- data
A layer specific dataset, only needed if you want to override the plot defaults.
- geom
The geometric object to use display the data
- position
The position adjustment to use for overlapping points on this layer.
- ...
other arguments passed on to
layer. This can include aesthetics whose values you want to set, not map. Seelayerfor more details.- method
function or character If character, "lm", "rlm", "lmrob", "lts", "gls", "ma", "sma", "segreg", "rq" or the name of a model fit function are accepted, possibly followed by the fit function's
methodargument separated by a colon (e.g."rlm:M"). If a function is different tolm(),rlm(),ltsReg(),gls(),ma,sma, it must have formal parameters namedformula,data, andweights. See Details.- method.args, tidy.args
lists of arguments to pass to
methodand totidy().- n.min
integer Minimum number of distinct values in the explanatory variable (on the rhs of formula) for fitting to the attempted.
- fit.seed
RNG seed argument passed to
set.seed(). Defaults toNA, indicating thatset.seed()should not be called.- tb.type
character One of
"fit.summary","fit.anova"or"fit.coefs".- tb.vars, tb.params
character or numeric vectors, optionally named, used to select and/or rename the columns or the parameters in the table returned.
- digits
integer indicating the number of significant digits to be used for all numeric values in the table.
- p.digits
integer indicating the number of decimal places to round p-values to, with those rounded to zero displayed as the next larger possible value preceded by "<". If
p.digitsis outside the range 1..22 no rounding takes place.- label.x, label.y
numericwith range 0..1 "normalized parent coordinates" (npc units) or character if usinggeom_text_npc()orgeom_label_npc(). If usinggeom_text()orgeom_label()numeric in native data units. If too short they will be recycled.- table.theme
NULL, list or function A 'gridExtra'
tthemedefinition, or a constructor for atthemeor NULL for default.- table.rownames, table.colnames
logical flag to enable or disabling printing of row names and column names.
- table.hjust
numeric Horizontal justification for the core and column headings of the table.
- parse
logical Passed to the geom. If
TRUE, the labels will be parsed into expressions and displayed as described inplotmath. Default isTRUEifoutput.type = "expression"andFALSEotherwise.- na.rm
a logical indicating whether NA values should be stripped before the computation proceeds.
- show.legend
logical. Should this layer be included in the legends?
NA, the default, includes if any aesthetics are mapped.FALSEnever includes, andTRUEalways includes.- inherit.aes
If
FALSE, overrides the default aesthetics, rather than combining with them. This is most useful for helper functions that define both data and aesthetics and shouldn't inherit behaviour from the default plot specification, e.g.borders.
Value
A tibble with columns named fm.tb (a tibble returned by
tidy() with possibly renamed and subset columns and rows, within a
list), fm.tb.type (copy of argument passed to tb.type),
fm.class (the class of the fitted model object), fm.method
(the fit function's name), fm.call (the call if available), x
and y.
To explore the values returned by this statistic, which vary depending on
the model fitting function and model formula we suggest the use of
geom_debug.
Details
stat_fit_tb() Applies a model fitting function per panel,
using the grouping factors from aesthetic mappings in the fitted model.
This is suitable, for example for analysis of variance used to test for
differences among groups.
The argument to method can be any fit method for which a suitable
tidy() method is available, including non-linear regression. Fit
methods retain their default arguments unless overridden.
Computed variables
The output of tidy() is returned as a
single "cell" in a tibble (i.e., a tibble nested within a tibble). The
returned data object contains a single tibble, containing the result
from a single model fit to all data in a panel. If grouping is present, it
is ignored in the sense of returning a single table, but the grouping
aesthetic can be a term in the fitted model.
Model formula and model fitting
A ggplot statistic receives as data a data frame that is not the one
passed as argument by the user, but instead a data frame with the variables
mapped to aesthetics. In stat_poly_eq() the compute function is
applied by group, each call "seeing" the subset of data for an
individual group. As supported models are for regression lines,
variables mapped to x and y should both be continuous, i.e.,
numeric or date time and model formulas defined using x and y
as variable names.
The interpretation of the argument passed to formula is enhanced
compared to stat_smooth(). Formulas with x as explanatory
variable work as in stat_smooth() but formulas with y as
explanatory variable are also accepted. orientation is set
automatically based on which explanatory variable appears in the formula.
Spline-based smoothers are only partially supported.
Model fit methods supported
Several model fit functions are supported explicitly (see tables), and some
of their differences smoothed out. Compatibility is checked late, based on
the class of the returned fitted model object. This makes it possible to
use wrapper functions that do model selection or other adjustments to the
fit procedure on a per panel or per group basis. Moreover, if the value
returned as model fit object is NULL or NA, plotting is
skipped on a per group within panel basis.
In the case of fitted model objects of classes not explicitly supported, an attempt is made to find the usual accessors and/or fitted object members, and if found, either complete or partial support is frequently achieved. In this case a message is issued encouraging users to check the validity of the values extracted as the structure of fitted model objects belonging to different classes and the values returned by their accessors can vary, potentially resulting in decoding errors leading to the return of wrong values for estimates.
The argument to parameter method can be either the name of a
function object, possibly using double colon notation in case its package
is not attached, or a character string matching the function name for
functions in the search path. This approach makes it possible to support
model fit functions that are not dependencies of 'ggpmisc'. Either by
attaching the package where the function is defined and passing it by name
or as string, or using double colon notation when passing the name of the
function.
User-defined functions can be passed as argument to parameter method
as long as they have parameters formula, data subset
and possibly weights. Additional arguments can be passed to any
method as a named list through parameter method.args. As in
stat_smooth() prior weights are
passed to the model fit functions' weights (plural!) parameter by
mapping a numeric variable to plot aesthetic weight (singular!).
Tables 1 lists natively supported model fit functions, with the caveat that only some 'broom' methods' specializations have been actually tested with statistics from 'ggpmisc'. In addition, the statistics based on 'broom' methods require the user to tailor their behaviour by passing additional arguments in the call and occasionally some detective work to find out the names of variables in the returned data frame as these names are set by methods from 'broom'.
Table 1. Model fit methods supported by the different statistics available in package 'ggpmisc'. Column \(f\) indicates whether computations are done by group (G) or by plot panel (P).
| Statistic | \(f\) | Supported model fit methods |
stat_poly_line() | G | "lm", "rlm", "lts", "sma", "ma", "gls", others with methods predict() or fitted() |
stat_poly_eq() | G | "lm", "rlm", "lts", "sma", "ma", "gls", others with needed accesors |
stat_quant_line() | G | "rq", "rqss" |
stat_quant_band() | G | "rq", "rqss" |
stat_quant_eq() | G | "rq", "rqss" |
stat_ma_line() | G | "SMA", "MA", "RMA", "OLS" |
stat_ma_eq() | G | "SMA", "MA", "RMA", "OLS" |
stat_fit_residuals() | G | "lm", "rlm", "lts", "sma", "ma", "gls", "rq", "rqss" others with method residuals() |
stat_fit_fitted() | G | "lm", "rlm", "lts", "gls", "rq", "rqss" others with method fitted() |
stat_fit_deviations() | G | "lm", "rlm", "lts", "gls", "rq", "rqss" others with methods fitted() and weights() |
stat_fit_augment() | G | any with 'broom' method augment() |
stat_fit_glance() | G | any with 'broom' method glance() |
stat_fit_tidy() | G | any with 'broom' method tidy() |
stat_fit_tb() | P | any with 'broom' method tidy() |
The single colon notation is based on parsing
the name and is available when passing the name of the fit method as a
character string. In a string such as "head:tail" the "head" gives the name
of the model fit function and the "tail" gives the argument to pass it's
method parameter. This is only a convenience, as method.args
can be also used. In some methods, i.e., splines, the default
formula = y ~ x needs to be overridden by the user.
Table 2 lists the correspondence of pre-defined method names to model fit method functions. As mentioned above, these are only a subset of the model fit methods that are expected to work. When using these names there is no need for users to attach additional packages but the packages must be available (installed).
Table 2. Available predefined method names, the model fit functions
they call, the packages where the functions reside, the class of the
returned fitted model object and the arguments that can be
passed to their method parameter using single colon notation.
| Predefined method names | Model fit methods | R package | Object class |
| "lm", "lm:qr" | lm() | 'stats' | "lm" |
| "rlm", "rlm:M", "rlm:MM" | rlm() | 'MASS' | "rlm" ("lm") |
| "lts", "ltsReg" | ltsReg() | 'robustbase' | "lts" |
| "ma", "sma", "sma:SMA", "sma:MA", "sma:OLS" | sma() | 'smatr' | "ma" or "sma" |
| "gls", "gls:REML", "gls:ML" | gls() | 'nlme' | "gls" |
| "rq", "rq:sfn", "rq:sfnc", "rq:lasso" | rq() | 'quantreg' | "rq" |
| "rqss", "rqss:sfn", "rqss:sfnc", "rqss:lasso" | rqss() | 'quantreg' | "rqss" |
| "SMA", "MA", "RMA", "OLS" | lmodel2() | 'lmodel2' | ("list") |
See also
Package broom for details on how the tidying of
the result of model fits is done. See geom_table for
details on how inset tables respond to mapped aesthetics and table themes.
For details on predefined table themes see
ttheme_gtdefault.
Other 'ggpmisc' statistics for model fits:
stat_distrmix_eq(),
stat_fit_deviations(),
stat_fit_glance(),
stat_fit_tidy(),
stat_ma_eq(),
stat_poly_eq(),
stat_quant_band()
Aesthetics
stat_fit_tb() understands the following aesthetics. Required aesthetics are displayed in bold and defaults are displayed for optional aesthetics:
| • | x | |
| • | y | |
| • | group | → inferred |
| • | hjust | → "inward" |
| • | label | → after_stat(fm.tb) |
| • | vjust | → "inward" |
Learn more about setting these aesthetics in vignette("ggplot2-specs").
Examples
# Package 'broom' needs to be installed to run these examples.
# We check availability before running them to avoid errors.
broom.installed <- requireNamespace("broom", quietly = TRUE)
if (broom.installed)
library(broom)
# data for examples
x <- c(44.4, 45.9, 41.9, 53.3, 44.7, 44.1, 50.7, 45.2, 60.1)
covariate <- sqrt(x) + rnorm(9)
group <- factor(c(rep("A", 4), rep("B", 5)))
my.df <- data.frame(x, group, covariate)
gginnards.installed <- requireNamespace("gginnards", quietly = TRUE)
if (gginnards.installed)
library(gginnards)
## covariate is a numeric or continuous variable
# Linear regression fit summary, all defaults
if (broom.installed)
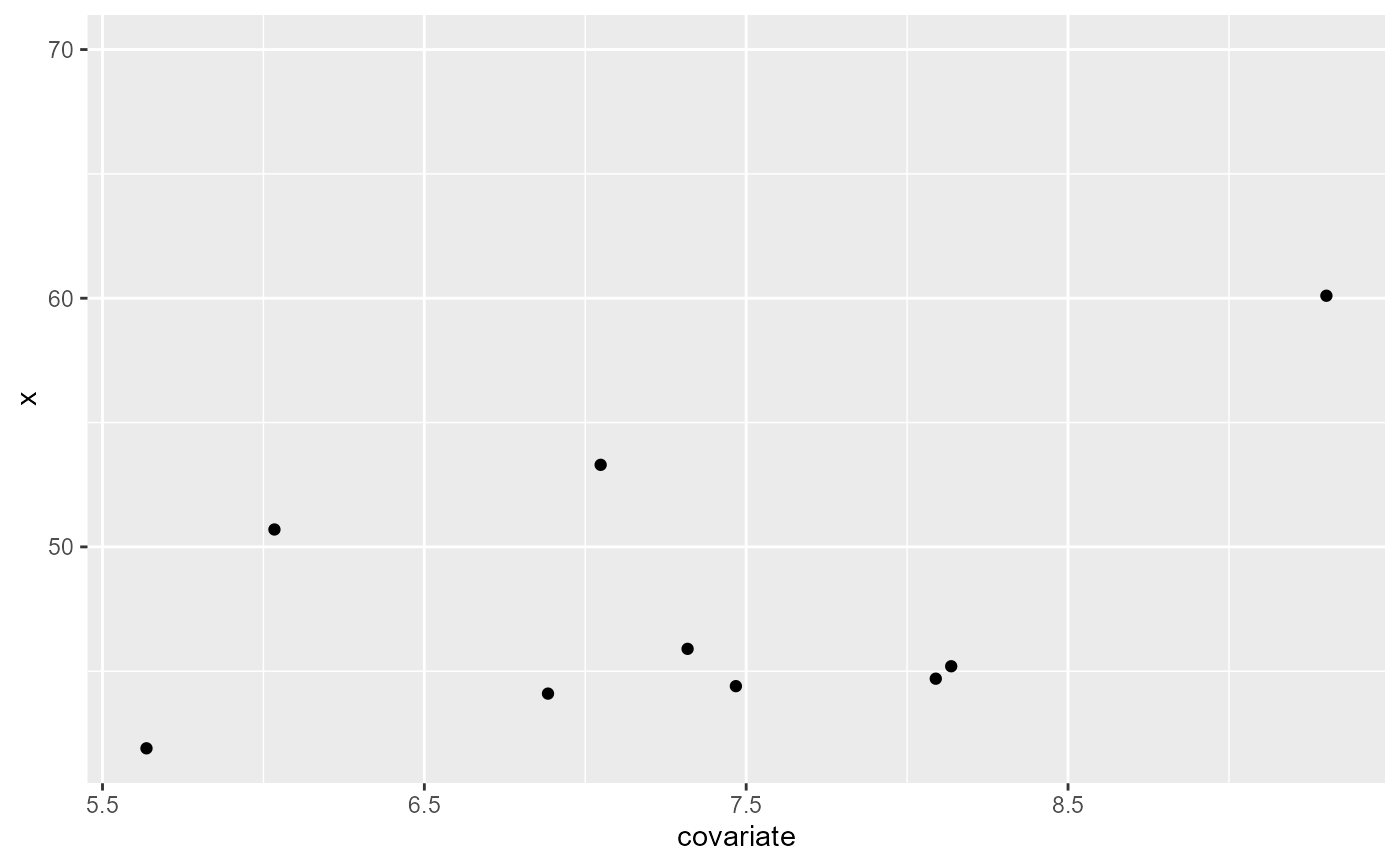
ggplot(my.df, aes(covariate, x)) +
geom_point() +
stat_fit_tb() +
expand_limits(y = 70)
 # we can use geom_debug_panel() and str() to inspect the returned value
# and discover the variables that can be mapped to aesthetics with
# after_stat()
if (broom.installed && gginnards.installed)
ggplot(my.df, aes(covariate, x)) +
geom_point() +
stat_fit_tb(geom = "debug_panel", dbgfun.data = str) +
expand_limits(y = 70)
#> Warning: Ignoring unknown parameters: `table.theme`, `table.rownames`, `table.colnames`,
#> `table.hjust`, and `parse`
# we can use geom_debug_panel() and str() to inspect the returned value
# and discover the variables that can be mapped to aesthetics with
# after_stat()
if (broom.installed && gginnards.installed)
ggplot(my.df, aes(covariate, x)) +
geom_point() +
stat_fit_tb(geom = "debug_panel", dbgfun.data = str) +
expand_limits(y = 70)
#> Warning: Ignoring unknown parameters: `table.theme`, `table.rownames`, `table.colnames`,
#> `table.hjust`, and `parse`
 #> 'data.frame': 1 obs. of 13 variables:
#> $ PANEL : Factor w/ 1 level "1": 1
#> $ x : num 7.47
#> $ y : num 70
#> $ group : int -1
#> $ fm.tb :List of 1
#> ..$ : tibble [2 × 5] (S3: tbl_df/tbl/data.frame)
#> .. ..$ term : chr "(Intercept)" "x"
#> .. ..$ estimate : num 28.9 2.58
#> .. ..$ std.error: num 12.6 1.71
#> .. ..$ statistic: num 2.29 1.51
#> .. ..$ p.value : chr "0.056" "0.175"
#> $ fm.tb.type : chr "fit.summary"
#> $ fm.class : chr "lm"
#> $ fm.method : chr "lm"
#> $ fm.formula :List of 1
#> ..$ formula:Class 'formula' language y ~ x
#> .. .. ..- attr(*, ".Environment")=<environment: 0x000002188250eac0>
#> $ fm.formula.chr: Named chr "y ~ x"
#> ..- attr(*, "names")= chr "formula"
#> $ npcx : num NA
#> $ npcy : num NA
#> $ label :List of 1
#> ..$ : tibble [2 × 5] (S3: tbl_df/tbl/data.frame)
#> .. ..$ term : chr "(Intercept)" "x"
#> .. ..$ estimate : num 28.9 2.58
#> .. ..$ std.error: num 12.6 1.71
#> .. ..$ statistic: num 2.29 1.51
#> .. ..$ p.value : chr "0.056" "0.175"
#> [1] "PANEL 1; group(s) -1; 'draw_function()' input 'data' (anonymous function):"
#> NULL
# Linear regression fit summary, with default formatting
if (broom.installed)
ggplot(my.df, aes(covariate, x)) +
geom_point() +
stat_fit_tb(tb.type = "fit.summary") +
expand_limits(y = 70)
#> 'data.frame': 1 obs. of 13 variables:
#> $ PANEL : Factor w/ 1 level "1": 1
#> $ x : num 7.47
#> $ y : num 70
#> $ group : int -1
#> $ fm.tb :List of 1
#> ..$ : tibble [2 × 5] (S3: tbl_df/tbl/data.frame)
#> .. ..$ term : chr "(Intercept)" "x"
#> .. ..$ estimate : num 28.9 2.58
#> .. ..$ std.error: num 12.6 1.71
#> .. ..$ statistic: num 2.29 1.51
#> .. ..$ p.value : chr "0.056" "0.175"
#> $ fm.tb.type : chr "fit.summary"
#> $ fm.class : chr "lm"
#> $ fm.method : chr "lm"
#> $ fm.formula :List of 1
#> ..$ formula:Class 'formula' language y ~ x
#> .. .. ..- attr(*, ".Environment")=<environment: 0x000002188250eac0>
#> $ fm.formula.chr: Named chr "y ~ x"
#> ..- attr(*, "names")= chr "formula"
#> $ npcx : num NA
#> $ npcy : num NA
#> $ label :List of 1
#> ..$ : tibble [2 × 5] (S3: tbl_df/tbl/data.frame)
#> .. ..$ term : chr "(Intercept)" "x"
#> .. ..$ estimate : num 28.9 2.58
#> .. ..$ std.error: num 12.6 1.71
#> .. ..$ statistic: num 2.29 1.51
#> .. ..$ p.value : chr "0.056" "0.175"
#> [1] "PANEL 1; group(s) -1; 'draw_function()' input 'data' (anonymous function):"
#> NULL
# Linear regression fit summary, with default formatting
if (broom.installed)
ggplot(my.df, aes(covariate, x)) +
geom_point() +
stat_fit_tb(tb.type = "fit.summary") +
expand_limits(y = 70)
 # Linear regression fit summary, with manual table formatting
if (broom.installed)
ggplot(my.df, aes(covariate, x)) +
geom_point() +
stat_fit_tb(digits = 2,
p.digits = 4,
tb.params = c("intercept" = 1, "covariate" = 2),
tb.vars = c(Term = 1, Estimate = 2,
"italic(s)" = 3, "italic(t)" = 4,
"italic(P)" = 5),
parse = TRUE) +
expand_limits(y = 70)
# Linear regression fit summary, with manual table formatting
if (broom.installed)
ggplot(my.df, aes(covariate, x)) +
geom_point() +
stat_fit_tb(digits = 2,
p.digits = 4,
tb.params = c("intercept" = 1, "covariate" = 2),
tb.vars = c(Term = 1, Estimate = 2,
"italic(s)" = 3, "italic(t)" = 4,
"italic(P)" = 5),
parse = TRUE) +
expand_limits(y = 70)
 # Linear regression ANOVA table, with default formatting
if (broom.installed)
ggplot(my.df, aes(covariate, x)) +
geom_point() +
stat_fit_tb(tb.type = "fit.anova") +
expand_limits(y = 70)
# Linear regression ANOVA table, with default formatting
if (broom.installed)
ggplot(my.df, aes(covariate, x)) +
geom_point() +
stat_fit_tb(tb.type = "fit.anova") +
expand_limits(y = 70)
 # Linear regression ANOVA table, with manual table formatting
if (broom.installed)
ggplot(my.df, aes(covariate, x)) +
geom_point() +
stat_fit_tb(tb.type = "fit.anova",
tb.params = c("Covariate" = 1, 2),
tb.vars = c(Effect = 1, d.f. = 2,
"M.S." = 4, "italic(F)" = 5,
"italic(P)" = 6),
parse = TRUE) +
expand_limits(y = 67)
# Linear regression ANOVA table, with manual table formatting
if (broom.installed)
ggplot(my.df, aes(covariate, x)) +
geom_point() +
stat_fit_tb(tb.type = "fit.anova",
tb.params = c("Covariate" = 1, 2),
tb.vars = c(Effect = 1, d.f. = 2,
"M.S." = 4, "italic(F)" = 5,
"italic(P)" = 6),
parse = TRUE) +
expand_limits(y = 67)
 # Linear regression fit coeficients, with default formatting
if (broom.installed)
ggplot(my.df, aes(covariate, x)) +
geom_point() +
stat_fit_tb(tb.type = "fit.coefs") +
expand_limits(y = 67)
# Linear regression fit coeficients, with default formatting
if (broom.installed)
ggplot(my.df, aes(covariate, x)) +
geom_point() +
stat_fit_tb(tb.type = "fit.coefs") +
expand_limits(y = 67)
 # Linear regression fit coeficients, with manual table formatting
if (broom.installed)
ggplot(my.df, aes(covariate, x)) +
geom_point() +
stat_fit_tb(tb.type = "fit.coefs",
tb.params = c(a = 1, b = 2),
tb.vars = c(Term = 1, Estimate = 2)) +
expand_limits(y = 67)
# Linear regression fit coeficients, with manual table formatting
if (broom.installed)
ggplot(my.df, aes(covariate, x)) +
geom_point() +
stat_fit_tb(tb.type = "fit.coefs",
tb.params = c(a = 1, b = 2),
tb.vars = c(Term = 1, Estimate = 2)) +
expand_limits(y = 67)
 ## x is also a numeric or continuous variable
# Polynomial regression, with default formatting
if (broom.installed)
ggplot(my.df, aes(covariate, x)) +
geom_point() +
stat_fit_tb(method.args = list(formula = y ~ poly(x, 2))) +
expand_limits(y = 70)
## x is also a numeric or continuous variable
# Polynomial regression, with default formatting
if (broom.installed)
ggplot(my.df, aes(covariate, x)) +
geom_point() +
stat_fit_tb(method.args = list(formula = y ~ poly(x, 2))) +
expand_limits(y = 70)
 # Polynomial regression, with manual table formatting
if (broom.installed)
ggplot(my.df, aes(covariate, x)) +
geom_point() +
stat_fit_tb(method.args = list(formula = y ~ poly(x, 2)),
tb.params = c("x^0" = 1, "x^1" = 2, "x^2" = 3),
tb.vars = c("Term" = 1, "Estimate" = 2, "S.E." = 3,
"italic(t)" = 4, "italic(P)" = 5),
parse = TRUE) +
expand_limits(y = 70)
# Polynomial regression, with manual table formatting
if (broom.installed)
ggplot(my.df, aes(covariate, x)) +
geom_point() +
stat_fit_tb(method.args = list(formula = y ~ poly(x, 2)),
tb.params = c("x^0" = 1, "x^1" = 2, "x^2" = 3),
tb.vars = c("Term" = 1, "Estimate" = 2, "S.E." = 3,
"italic(t)" = 4, "italic(P)" = 5),
parse = TRUE) +
expand_limits(y = 70)
 ## group is a factor or discrete variable
# ANOVA summary, with default formatting
if (broom.installed)
ggplot(my.df, aes(group, x)) +
geom_point() +
stat_fit_tb() +
expand_limits(y = 70)
## group is a factor or discrete variable
# ANOVA summary, with default formatting
if (broom.installed)
ggplot(my.df, aes(group, x)) +
geom_point() +
stat_fit_tb() +
expand_limits(y = 70)
 # ANOVA table, with default formatting
if (broom.installed)
ggplot(my.df, aes(group, x)) +
geom_point() +
stat_fit_tb(tb.type = "fit.anova") +
expand_limits(y = 70)
# ANOVA table, with default formatting
if (broom.installed)
ggplot(my.df, aes(group, x)) +
geom_point() +
stat_fit_tb(tb.type = "fit.anova") +
expand_limits(y = 70)
 # ANOVA table, with manual table formatting
if (broom.installed)
ggplot(my.df, aes(group, x)) +
geom_point() +
stat_fit_tb(tb.type = "fit.anova",
tb.vars = c(Effect = "term", "df", "italic(F)" = "statistic",
"italic(P)" = "p.value"),
tb.params = c(Group = 1, Error = 2),
parse = TRUE)
# ANOVA table, with manual table formatting
if (broom.installed)
ggplot(my.df, aes(group, x)) +
geom_point() +
stat_fit_tb(tb.type = "fit.anova",
tb.vars = c(Effect = "term", "df", "italic(F)" = "statistic",
"italic(P)" = "p.value"),
tb.params = c(Group = 1, Error = 2),
parse = TRUE)
 # ANOVA table, with manual table formatting
# using column names with partial matching
if (broom.installed)
ggplot(my.df, aes(group, x)) +
geom_point() +
stat_fit_tb(tb.type = "fit.anova",
tb.vars = c(Effect = "term", "df", "italic(F)" = "stat",
"italic(P)" = "p"),
tb.params = c(Group = "x", Error = "Resid"),
parse = TRUE)
# ANOVA table, with manual table formatting
# using column names with partial matching
if (broom.installed)
ggplot(my.df, aes(group, x)) +
geom_point() +
stat_fit_tb(tb.type = "fit.anova",
tb.vars = c(Effect = "term", "df", "italic(F)" = "stat",
"italic(P)" = "p"),
tb.params = c(Group = "x", Error = "Resid"),
parse = TRUE)
 # ANOVA summary, with default formatting
if (broom.installed)
ggplot(my.df, aes(group, x)) +
geom_point() +
stat_fit_tb() +
expand_limits(y = 70)
# ANOVA summary, with default formatting
if (broom.installed)
ggplot(my.df, aes(group, x)) +
geom_point() +
stat_fit_tb() +
expand_limits(y = 70)
 ## covariate is a numeric variable and group is a factor
# ANCOVA (covariate not plotted) ANOVA table, with default formatting
if (broom.installed)
ggplot(my.df, aes(group, x, z = covariate)) +
geom_point() +
stat_fit_tb(tb.type = "fit.anova",
method.args = list(formula = y ~ x + z))
## covariate is a numeric variable and group is a factor
# ANCOVA (covariate not plotted) ANOVA table, with default formatting
if (broom.installed)
ggplot(my.df, aes(group, x, z = covariate)) +
geom_point() +
stat_fit_tb(tb.type = "fit.anova",
method.args = list(formula = y ~ x + z))
 # ANCOVA (covariate not plotted) ANOVA table, with manual table formatting
if (broom.installed)
ggplot(my.df, aes(group, x, z = covariate)) +
geom_point() +
stat_fit_tb(tb.type = "fit.anova",
method.args = list(formula = y ~ x + z),
tb.vars = c(Effect = 1, d.f. = 2,
"M.S." = 4, "italic(F)" = 5,
"italic(P)" = 6),
tb.params = c(Group = 1,
Covariate = 2,
Error = 3),
parse = TRUE)
# ANCOVA (covariate not plotted) ANOVA table, with manual table formatting
if (broom.installed)
ggplot(my.df, aes(group, x, z = covariate)) +
geom_point() +
stat_fit_tb(tb.type = "fit.anova",
method.args = list(formula = y ~ x + z),
tb.vars = c(Effect = 1, d.f. = 2,
"M.S." = 4, "italic(F)" = 5,
"italic(P)" = 6),
tb.params = c(Group = 1,
Covariate = 2,
Error = 3),
parse = TRUE)
 ## group is a factor or discrete variable
# t-test, minimal output, with manual table formatting
if (broom.installed)
ggplot(my.df, aes(group, x)) +
geom_point() +
stat_fit_tb(method = "t.test",
tb.vars = c("italic(t)" = "statistic",
"italic(P)" = "p.value"),
parse = TRUE)
#> Dropping param names from table!
#> 'formula' extracted from arguments
## group is a factor or discrete variable
# t-test, minimal output, with manual table formatting
if (broom.installed)
ggplot(my.df, aes(group, x)) +
geom_point() +
stat_fit_tb(method = "t.test",
tb.vars = c("italic(t)" = "statistic",
"italic(P)" = "p.value"),
parse = TRUE)
#> Dropping param names from table!
#> 'formula' extracted from arguments
 # t-test, more detailed output, with manual table formatting
if (broom.installed)
ggplot(my.df, aes(group, x)) +
geom_point() +
stat_fit_tb(method = "t.test",
tb.vars = c("\"Delta \"*italic(x)" = "estimate",
"CI low" = "conf.low", "CI high" = "conf.high",
"italic(t)" = "statistic",
"italic(P)" = "p.value"),
parse = TRUE) +
expand_limits(y = 67)
#> 'formula' extracted from arguments
# t-test, more detailed output, with manual table formatting
if (broom.installed)
ggplot(my.df, aes(group, x)) +
geom_point() +
stat_fit_tb(method = "t.test",
tb.vars = c("\"Delta \"*italic(x)" = "estimate",
"CI low" = "conf.low", "CI high" = "conf.high",
"italic(t)" = "statistic",
"italic(P)" = "p.value"),
parse = TRUE) +
expand_limits(y = 67)
#> 'formula' extracted from arguments
 # t-test (equal variances assumed), minimal output, with manual
# table formatting
if (broom.installed)
ggplot(my.df, aes(group, x)) +
geom_point() +
stat_fit_tb(method = "t.test",
method.args = list(formula = y ~ x, var.equal = TRUE),
tb.vars = c("italic(t)" = "statistic",
"italic(P)" = "p.value"),
parse = TRUE)
#> Dropping param names from table!
#> 'formula' extracted from arguments
# t-test (equal variances assumed), minimal output, with manual
# table formatting
if (broom.installed)
ggplot(my.df, aes(group, x)) +
geom_point() +
stat_fit_tb(method = "t.test",
method.args = list(formula = y ~ x, var.equal = TRUE),
tb.vars = c("italic(t)" = "statistic",
"italic(P)" = "p.value"),
parse = TRUE)
#> Dropping param names from table!
#> 'formula' extracted from arguments
 ## covariate is a numeric or continuous variable
# Linear regression using a table theme and non-default position
if (broom.installed)
ggplot(my.df, aes(covariate, x)) +
geom_point() +
stat_fit_tb(table.theme = ttheme_gtlight,
npcx = "left", npcy = "bottom") +
expand_limits(y = 35)
## covariate is a numeric or continuous variable
# Linear regression using a table theme and non-default position
if (broom.installed)
ggplot(my.df, aes(covariate, x)) +
geom_point() +
stat_fit_tb(table.theme = ttheme_gtlight,
npcx = "left", npcy = "bottom") +
expand_limits(y = 35)
